4.5 Sampling Bias
Regardless of the sampling method we plan to use, it is always important to be aware of the dangers of sampling bias. Sampling bias occurs when some members of a population are systematically more likely to be selected in a sample than others, leading to a sample that is not representative of the entire population. This can distort the results of a study or analysis, making them unreliable or misleading.
Example 13: Caitlyn is the owner of a pet shop called Paws & Whiskers. She wants to gauge whether her customers are satisfied with the range of products stocked in her shop. If she only sends out surveys to customers who purchase dog food, this would systematically exclude all pet owners who have other pets, such as cats, reptiles, rabbits, mice, birds or fish.
The following are possible biases that may occur in practice:
4.5.1 Selection Bias
This type of bias occurs when certain population groups are systematically excluded or underrepresented in the sample. The pet shop example above illustrates selection bias.
Q: What other kinds of selection bias could occur? Who would be excluded if Caitlyn only sent out surveys to customers who made online purchases, or customers with a loyalty card?
4.5.2 Voluntary Response Bias
Voluntary response bias takes place when the individuals who participate in a study are self-selected. Typically, this will lead to the inclusion of only those individuals who have strong opinions and want to be heard, and will exclude individuals with more moderate opinions.
If Caitlyn posts her survey on social media, for instance, without encouraging all of her customers to participate, most of the responses will be from customers who are very unhappy, and perhaps a few customers who are extremely happy with her products.
Think about it: how often do you rate deliveries, apps, or other consumer experiences? Most of us will skip the rating step unless we are either very dissatisfied, or extremely happy with the experience.
4.5.3 Survivorship Bias
This kind of bias takes place when only “survivors” or of a population are considered, and those who have dropped out or failed are ignored.
Suppose Caitlyn is studying other pet shops to find out what she could do to improve her business. If she only studies successful pet shops, she might conclude that stocking dog food is all she needs to do in order to remain successful. However, this would ignore all of the pet shops who have had to downscale or close - all of whom have stocked dog food! Clearly, she would be in danger of drawing incorrect conclusions.
Another well-known example of survivorship bias occurred during World War II. American researchers were attempting to understand where bomber aircraft were most vulnerable, and reinforce those vulnerable areas to reduce the number of bombers that were being shot down. To do this, they initially studied damaged bombers to see where they had been hit. An example of such a bomber is shown in Figure 3, with the red dots representing bullet holes. However, they soon realised that this was an example of survivorship bias. The bullet holes in the bombers they were studying represented areas where bombers could be shot and still fly well enough to return to base. Bombers that had been hit in other places (like the fuselage) had been shot down over enemy territory, and did not return to base. Based on this, the scientists suggested that the areas should be reinforced that were not damaged on bombers that had returned. The scientists’ ability to understand survivorship bias was thus able to save many pilots’ lives.
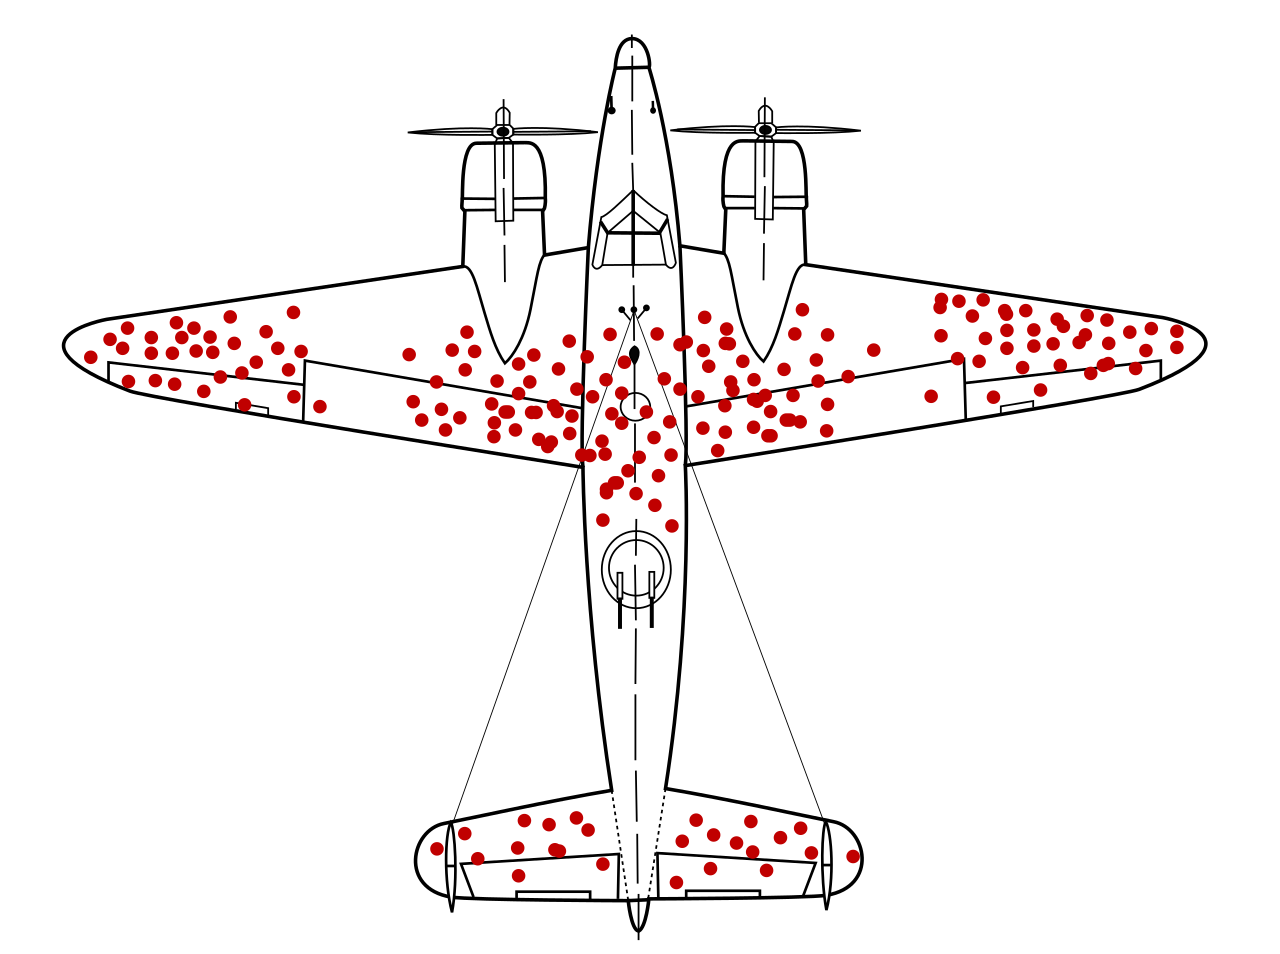
Figure 4.2: Figure 3: Illustration of survivorship bias in World War II planes. Image from Wikipedia: https://en.wikipedia.org/wiki/Survivorship_bias#/media/File:Survivorship-bias.svg/2
4.5.4 Time Interval Bias
This bias occurs when the data collected are influenced by the time period during which the sample is collected.
In the pet shop example, time interval bias would occur if Caitlyn collected data on dog jacket sales during summer. She might conclude that dog jackets are not a popular item, when in fact they are very popular in cold weather.
4.5.5 Convenience Sampling Bias
As the name suggests, this bias goes hand-in-hand with convenience sampling. When samples are taken only from a group that is easily accessible, this may not represent the general population.
In the pet shop example, Caitlyn might pose questions on her products to customers who are browsing the shop and are not in a hurry. This would be convenient, as she would be talking to relaxed customers who were in a good mood. However, this would exclude all of the customers who were in a hurry, or those who were in a bad mood because they could not find the product they were looking for! In this way, she would not obtain a representative sample of her customers.
4.5.6 Non-Response Bias
This kind of bias occurs when there is a substantial difference between individuals who respond to a survey, and those who do not. The effect of non-response bias can be similar to voluntary response bias. The difference is that in voluntary response bias, individuals are not selected in a random way. Thus, individuals are typically excluded if they do not have a strong opinion on the survey. In non-response bias, a proportion of the selected individuals decline to respond.
In the pet shop example, non-response bias could occur if Caitlyn selected a random sample of customers, and then phoned them during work hours. Customers with busy jobs would be more likely to decline her call, whereas those with lower intensity jobs, or those who were not employed, would be more likely to answer her questions.
4.5.7 Sampling Bias Summary
In summary, sampling bias can lead to a whole host of errors causing a sample to be unrepresentative of the population. If a researcher assumes that an unrepresentative sample is in fact representative, they could make very incorrect conclusions. These conclusions could be ineffective, or even harmful (the World War II plane example shows just how harmful this can be!).
It is therefore very important to understand and minimise sampling bias as much as possible. Properly designing a probabilistic sample can reduce most types of sampling bias. Additionally, non-response bias can be reduced by following up on those individuals who did not initially respond to the survey.
There are cases where non-probabilistic samples are acceptable for the purpose of the study at hand. However, the researcher must be aware of the fact that their sample does not necessarily reflect the population, and be careful when attempting to apply sample-based conclusions to the population. In the lion example, for instance, it might be acceptable for the researcher to study only those lions who drink at a waterhole that is accessible by Jeep. But, she would have to acknowledge this as a limitation in her study, and be careful of applying her conclusion to all lions. The lions who drink at the waterhole, for example, are able to drink enough water and do not suffer from dehydration. However, it would not be correct of her to assume that all of the lions in the park are properly hydrated, since there might be other lions at other locations in the park who do not have sufficient access to drinking water.
4.5.8 Sampling Bias versus Sampling Error
Finally, it is important to distinguish between sampling bias and sampling error. As explained previously, sampling bias occurs when individuals are excluded from the sample in some systematic way. This can be mitigated by improving the sampling design.
Sampling error, on the other hand, is a type of error that happens purely by chance. This error occurs because samples will almost never be perfectly representative of the population.
In the airport security example, Thabang could have a very well-designed sample, but could still miss a traveller who has a dangerous item in their luggage.
In the pet shop example, Caitlyn might conclude that 82% of her customers are satisfied with her products, based on a representative, probabilistic sample. However, the real number based on the population might be 80% or 85%.
The size of the sampling error can be estimated by using statistical techniques. For example, Caitlyn might be able to calculate that there is a 5% fluctuation in her results. In that case, even if the sample indicates that 82% of her customers are satisfied with her products, she will know that the true number could be as low as 77% or as high as 87%.
Nearly all samples will exhibit some degree of sampling error. This can be mitigated by increasing the sample size.
| Type of Error | Sampling Error | Sampling Bias |
| Cause | Random chance | Systematic problem in the sampling method |
| Effect | Estimates will vary slightly | Systematic error in the results |
| How to Mitigate | Increase the sample size | Redesign the study |
| Randomness of Error | Random (cannot be avoided) | Systematic (can be avoided) |
| Severity | Not necessarily severe; will always occur | Very severe - can have harmful consequences unless the study is redone |
| Example | A survey finds that 82% of customers are happy when the true number is 84% | The World War II bomber example |