1.5 Data Exploration – Foundations and Concepts
Data exploration is an important first step in the data analysis process. It involves uncovering the characteristics, patterns and hidden insights in the observed data set in an effort to gain a deeper understanding of the data. This step is usually referred to as exploratory data analysis (EDA). During EDA, statistical techniques are used to look for similarities, patterns, anomalies and also identify relationships between the different variables in the raw data. This step is also important for investigating the quality of the data by identifying missing values, duplicate data entries and\or inconsistencies in the data. Data exploration can be seen as part of, or as following, the data preparation step in the data management process.
1.5.1 Approaches to exploratory data analysis
Descriptive statistics are the main numerical features of the data such as the central tendency of the data (using the mean or median) and the spread of the data (using the variance or standard deviation). For instance, suppose you are a quantitative analyst working for a bank and you have a spreadsheet of the loan amounts given out during the current financial period. A descriptive analysis, such as calculating the mean and standard deviation of the loan amount, can give you the average loan amount and the dispersion in the loan amounts, respectively. As another example, suppose we want to understand the relationship between wind speed and air temperature, we can calculate the covariance to identify whether there is a relationship between these variables, and if so, is it positive or negative. Moreover, we can calculate the correlation coefficient to quantify the strength of the relationship.
Tabular and graphical statistics are summaries and interpretations of the data using graphs and tables. This is useful for identifying trends and relationships between numerical variables (using scatter plots) and categorical variables (using cross-tabulations), distributional patterns (using histograms, frequency distributions and the ogive) and outliers (using a box-and-whisker plot). For instance, the figure below shows a box and whisker plot of a sample of data. It can be seen from the figure that the data point marked “Outlier” might be unusual in relation to the rest of the data.
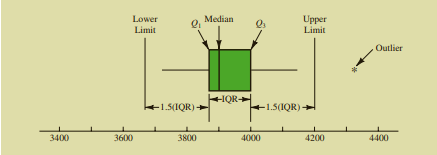
Figure 1.5: A box-and-whisker plot showing an outlier
- Inferential statistics uses sampled data to draw conclusions about the population. This includes testing various hypotheses statements you may have about the population where the data was obtained such as whether certain variables follow a specific distribution or whether the observed relationship between two or more variables, from a graph, is significant. For instance, suppose that you are a quantitative analyst for a bank and you want to test the hypothesis that the average loan amount for male clients is large than that of female clients. This type of test can be easily performed using the Data Analysis tool in Microsoft Excel.
1.5.2 Advantages and disadvantages of data exploration
Data exploration has several benefits, including:
Offering a comprehensive understanding of the data set before conducting the actual analysis.
Enhancing the quality of the data.
Highlighting important features and potential issues
Providing insight into appropriate analysis techniques
Guiding future research questions and directions
Limitations of data exploration may include:
Difficulty visualizing the high-dimensional data
May become complex for complicated data structures
It can be time consuming and subjective.
Misrepresenting data by choosing the wrong summary indicators
1.5.3 Stages in the exploratory data analysis process
The data exploration process involves a series of stages or steps which are aimed at obtaining a comprehensive understanding of the data and the implications thereafter. This includes
Understand the problem understudy
A crucial first step in the EDA process is to clearly state the problem that led to the collection of the data. This will help in various ways, such as formulating relevant questions, choosing the appropriate analytical tools and identifying inconsistencies or anomalies in the data.
Examine the structure of the data
Once you have a clear understanding of the problem, the next step is to familiarise yourself with the data by examining its structure which includes the size of the data, the number of variables and their data types. Check for inconsistencies and anomalies in the data and also missing values or data entries.
Handle the inconsistencies, anomalies and missing values
The next crucial step is to have a strategy to handle any inconsistencies, anomalies and\or missing data entries identified in the second step.
Examine the statistical aspects of the data
After addressing the issues identified in the second step, the next step involves the examination of the distribution, central tendency and variability of all the numerical variables. Moreover, various assumptions about the data can be tested. Among other things, this exercise will assist in identifying variables that deviate from expected patterns and may need further processing.
Transform the data for analysis
The next step is to prepare the data to be ready for data analysis. Based on your insights from the previous step, you may have to apply certain transformations to the data to make them conform to expectations. This involves, among others, standardizing or normalizing numerical variables, taking the log or square root to correct for skewness in numerical variables and dummy coding categorical variables.
Visualize the data
After transforming the data, you can now visualize it using tables and graphs such as frequency distributions and histograms. Data visualization is covered in some detail in Section 1.6.
Communicate the findings and use them for further data analysis.
1.5.4 Exercises to Section 1.5
Question 1
What is data exploration?
Question 2
For each of the following scenarios, identify the approach used for data exploration:
a. A research team analysed the health data of City of Tshwane residents. They found that 12% of the residents have at least one non-communicable disease.
b. An environmental scientist analysed data on monthly carbon dioxide (CO2) emissions and the monthly number of people hospitalized for respiratory issues in Pretoria. A scatter plot showed that there is a positive relationship between these two variables.
c. A fitness instructor analysed data on the exercise patterns of people in the district of the Cape Winelands in the Western Cape. She plotted the data on a histogram and found a bimodal distribution of exercise habits, suggesting that there are two distinct behavioural groups.
d. A marine biologist analysed data collected over 10 years by sensors from the bottom of the Indian ocean. She found that the average temperature was 24 degrees Celsius.
e.A hospital administrator at Hatfield General hospital claims that less than 10% of the daily hospital admissions are for serious injuries. In an analysis of hospital data, he was able to confirm his claim.